Fishery Simulation Lab
Collaborators-
Griffin Matthews and Ryan Baldwin
Griffin Matthews and Ryan Baldwin
Abstract-
An experiment was conducted using an online, virtual fishing simulator to simulate the effects of limiting factors of food abundance, predators, reproduction, disease, pollution, death, fishing, and migration on a virtual tuna population. 4 stages were used to simulate all 8 limiting factors. Most notably are the devastating effects of disease and pollution on the population which would sometimes inflict a 50% hit to the population of fish. Another notable result was the effect of overfishing which has a "Tragedy of the Commons" effect, where the the population will inevitably decline with out regulations.The hypothesis stated that the tuna population would always recover from an abnormality in its environment such as over fishing or pollution, unless the population is pushed past the zone of intolerance. The results reflect the hypothesis well and the hypothesis was fairly accurate.
An experiment was conducted using an online, virtual fishing simulator to simulate the effects of limiting factors of food abundance, predators, reproduction, disease, pollution, death, fishing, and migration on a virtual tuna population. 4 stages were used to simulate all 8 limiting factors. Most notably are the devastating effects of disease and pollution on the population which would sometimes inflict a 50% hit to the population of fish. Another notable result was the effect of overfishing which has a "Tragedy of the Commons" effect, where the the population will inevitably decline with out regulations.The hypothesis stated that the tuna population would always recover from an abnormality in its environment such as over fishing or pollution, unless the population is pushed past the zone of intolerance. The results reflect the hypothesis well and the hypothesis was fairly accurate.
Problem-
What are the effects of limiting factors on the population of tuna?
What are the effects of limiting factors on the population of tuna?
Hypothesis-
If the simulation operator manipulated one of the death, migration, reproduction, or any of the other sliders (the thing that is clicked and dragged to manipulate the variables on the simulator) to its maximum or minimum level, then the population will rise slower or faster corresponding to which limiting factor was changed, but the population will always even out to its carrying capacity unless it is pushed well beyond the zone of tolerance.
If the simulation operator manipulated one of the death, migration, reproduction, or any of the other sliders (the thing that is clicked and dragged to manipulate the variables on the simulator) to its maximum or minimum level, then the population will rise slower or faster corresponding to which limiting factor was changed, but the population will always even out to its carrying capacity unless it is pushed well beyond the zone of tolerance.
Parts of the Experiment-
Control Group- None (according to the lab).
Experimental Group- None (according to the lab).
Independent Variable- Limiting factors - disease, pollution, reproduction, predators, migration, food, death, and seasonal fishing.
Dependent Variable- The population of tuna.
Control- The normal population line on the graph.
Materials-
Computer with internet access
A virtual fish population simulation website (Link to website)
Computer with internet access
A virtual fish population simulation website (Link to website)
Methods-
1. Work though the tutorial of the simulator.
2. Start experimenting with different levels of different limiting factors and create a hypothesis for the effect that each limiting factor will have.
3. Take note of the population level and how it responds to changes.
4. Change the settings until you have a sustained population of 60,000 tuna.
5. Repeat step 4 except aim for a population of 80,000 tuna.
6. Proceed to stage 2 and repeat steps 2-4 for stage 2. Pollution and disease will occur at random.
7. Proceed to stage 3 and repeat steps 2-4 for stage 3.
8. Stage 4 combines stages 1-3. All factors are considered in stage 4. Repeat steps 2-4 for stage 4. Find the maximum amount of fishing that can be done before the tuna population starts to decline.
9. Discuss the conclusion questions with your partner.
Data- Look in the descriptions of photos for more information.
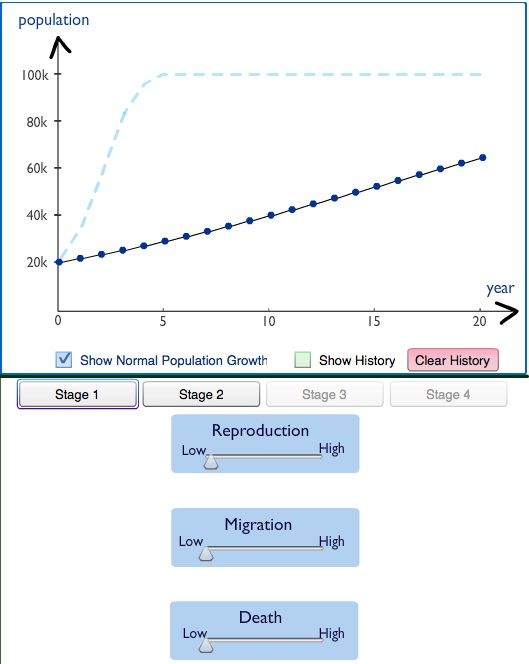
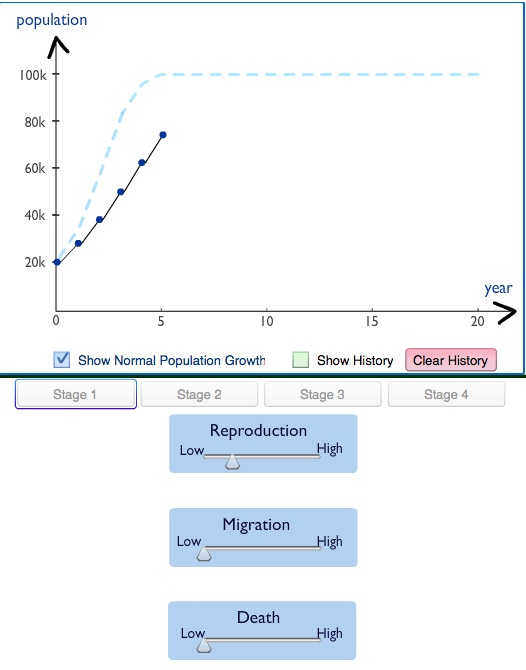
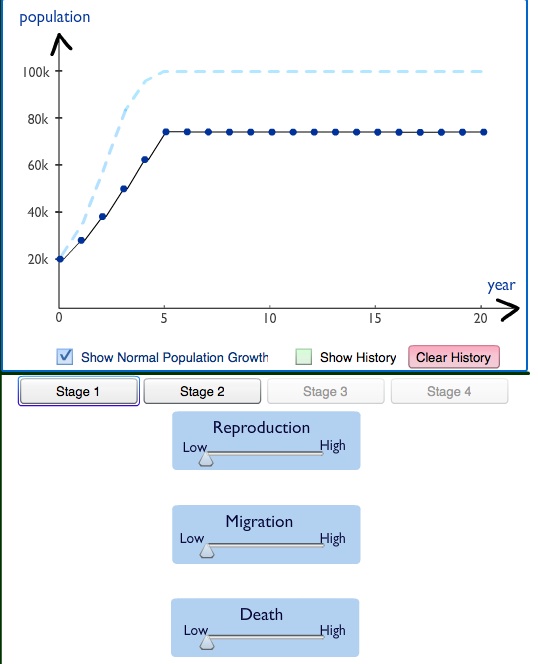
Stage 1
All 3 limiting factors when set to high, increase the population drastically
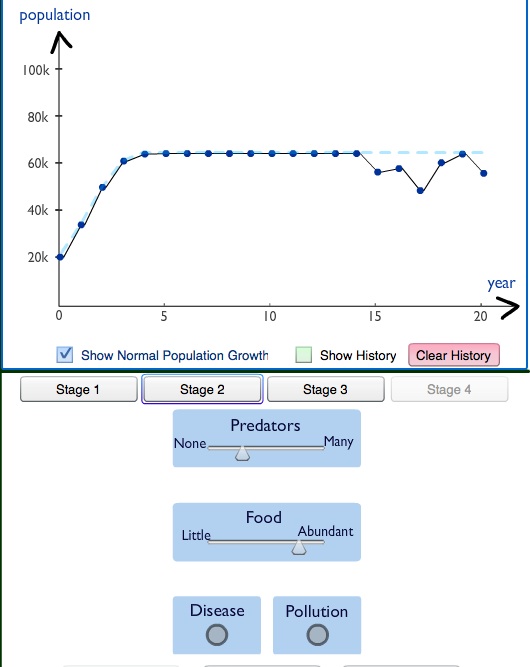
Stage 2
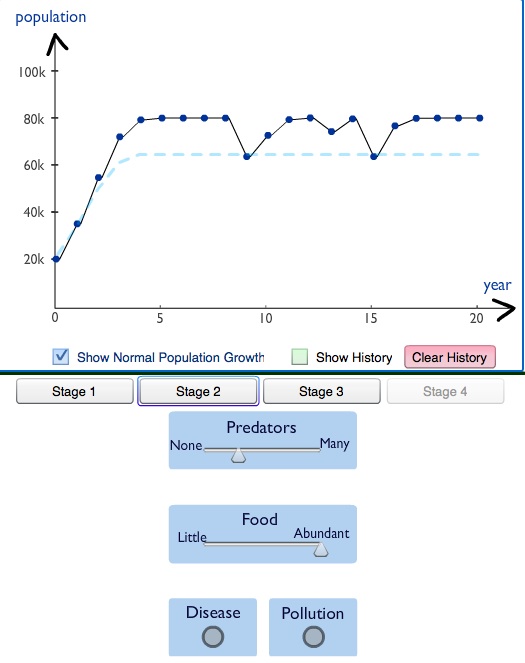
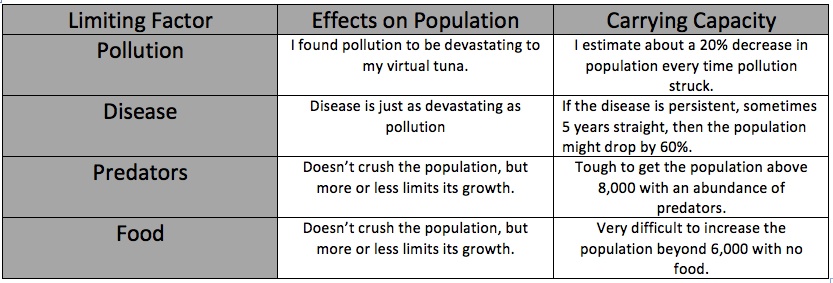
As you would expect, lots of predators and no food makes the population drop to almost zero. Disease and pollution, for lack of a better term, absolutely crushes the population, especially when it is persistent year over year.
Stage 3
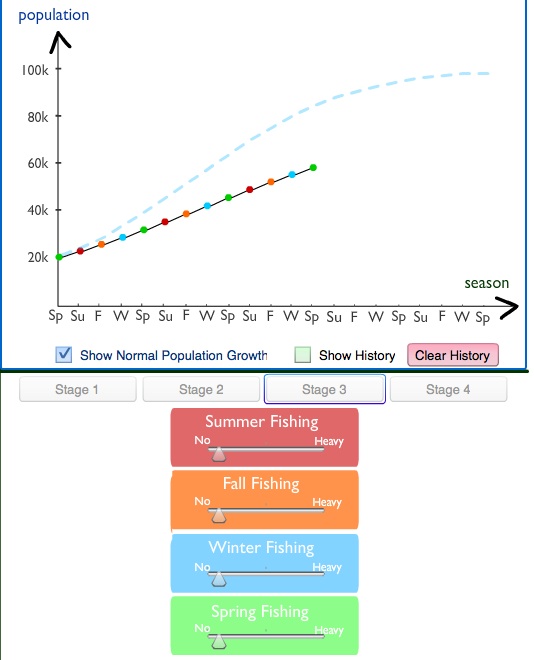
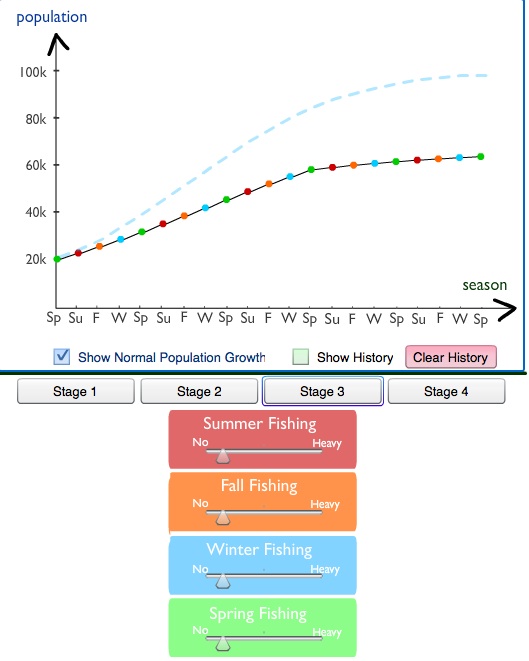
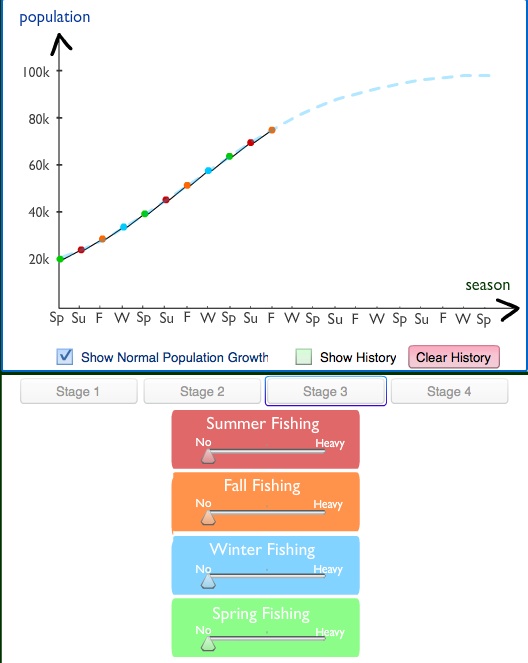
With no fishing at any time, the population follows a smooth growth. When there is seasonal fishing, the population falls in the corresponding season. Any sort of fishing anytime severely hurts the population.
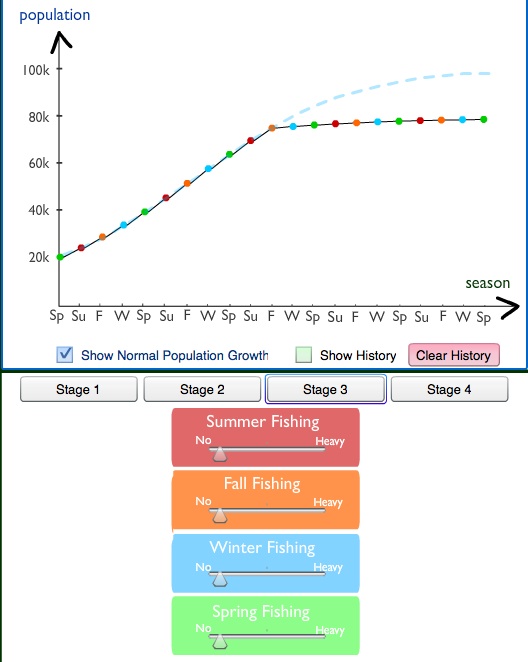
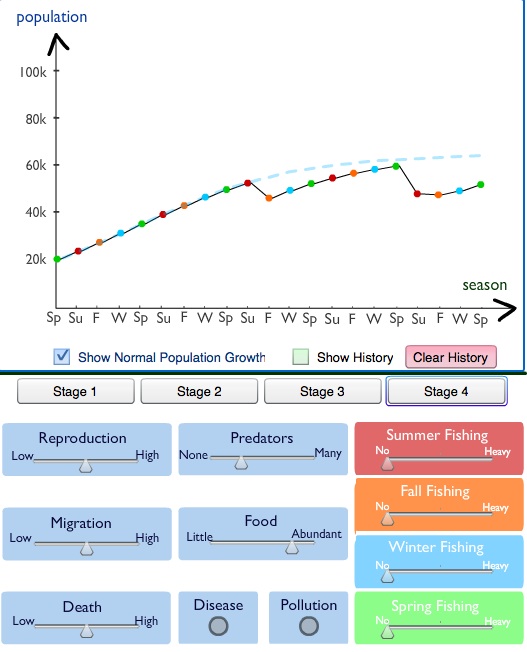
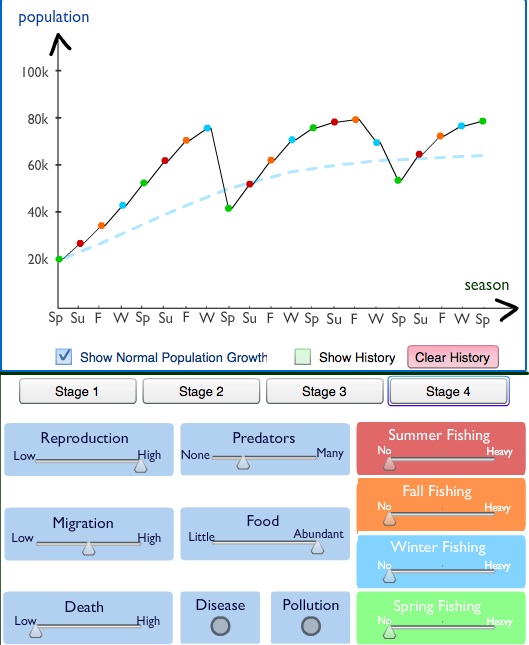
Stage 4
Stage 4 is stages 1-3 together in one, all variables included, all things considered. It is literally impossible to get smooth population lines due to the inability to disable disease and pollution.
Data Analysis-
It is worth noting that the population, while the population has limiting factors, always levels itself out to its carrying capacity. This always happens unless a limiting factor goes beyond its zone of tolerance. This reflects the hypothesis in the way that the populations have a way of recovering even after a devastating epidemic or pollution phase. Many times this happened even though those charts were not included in the data.
It is worth noting that the population, while the population has limiting factors, always levels itself out to its carrying capacity. This always happens unless a limiting factor goes beyond its zone of tolerance. This reflects the hypothesis in the way that the populations have a way of recovering even after a devastating epidemic or pollution phase. Many times this happened even though those charts were not included in the data.
Conclusion-
Stage 1- Our limiting factors in stage 1 were the rate of reproduction, migration, and death. The carrying capacity is 100,000 for stage 1.
Stage 2- Further along in the simulation, when pollution and disease became an issue, there would be a near 50% drop in population in a year from pollution and a 10% to 50% drop when disease struck, depending on the length of disease. It took about 4 years for the population to recover from 1 year of pollution and about 2 years to recover from 1 year of disease.
Stage 3- Later, fishing became a factor. To maintain a population of 60,000, the oceans would require quite strict fishing regulations as indicated by the charts in part 3. In the Mediterranean Sea, the tuna populations are dwindling due to overfishing. This website run by the World Wildlife Fund on the yellowfin tuna has a page about the overfishing hurting tuna populations. (Link to Article) I believe that this is the most hurtful limiting factor effecting real world populations right now. This compares to "Tragedy of the Commons" in the way that the fish are considered commons and when you have everyone drawing from the commons, the resource will inevitably run out.
Stage 4- The safest and maximum fishing levels were having all the seasonal sliders at 25%. This made the population neither grow nor decline. A density-dependant factor would be food. As the population grows the more food it needs and eventually the food runs out. A density-independant variable is fishing, where it really doesn't matter how big the population is. If a population is overfished, the population is hurt regardless. This simulation could be used by biologists to predict population patterns to put in place fishing regulations and to determine the starts and beginnings of commercial fishing seasons. This can help them make sure that the regulations would work instead of the regulations being less than effective.
It would have been nice to be able to turn off disease and pollution so reliable charts could have been gathered in stages 2 and 4. The hypothesis was for the most part right. Sometimes when the simulation was ran, a pollution spike would occur an would quite literally reduce the population to 0. So, in those rare cases the population would not bounce back. But, for the most part, as long as the sliders were set to a reasonable setting, the population would eventually recover.
Citation-
"Tuna." WorldWildlife.org. World Wildlife Fund, n.d. Web. 28 Sept. 2013
"Tuna." WorldWildlife.org. World Wildlife Fund, n.d. Web. 28 Sept. 2013
