Image Above: Beads, similar to those used in the experiment.
Catch and Release lab
Collaborators-
Griffin Matthews and Sarah Ondrish. Class data compiled from Mr. Gunsher's 1st period AP Environmental Science class in its entirety.
Griffin Matthews and Sarah Ondrish. Class data compiled from Mr. Gunsher's 1st period AP Environmental Science class in its entirety.
Abstract-
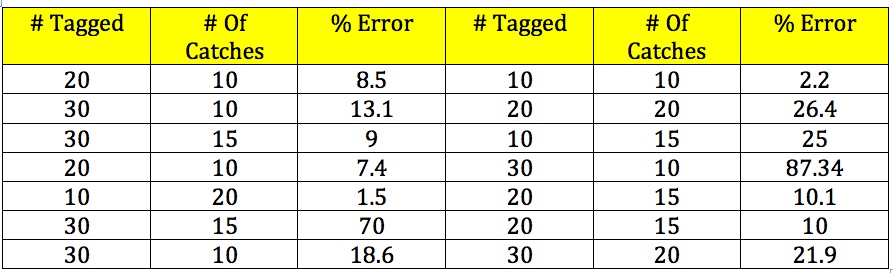
An experiment was conducted to find the optimal sampling amounts to best estimate the population of fish in an ocean. In this experiment, a paper bag represented the ocean and beads represented fish. 30 of the beads were removed and replaced by different colored beads to show tagged fish in the ocean. 15 random catches of varying numbers of fish were taken and the number of tagged fish per catch was noted. This data was used to estimate the population. The percent error for the 30 tagged fish and 15 catch group was 70%. The data did not support the hypothesis which predicted that more tagged fish and more catches would yield more accurate results. The most successful combination was 10 tagged fish and 15 catch samples with a 1.5% error.
An experiment was conducted to find the optimal sampling amounts to best estimate the population of fish in an ocean. In this experiment, a paper bag represented the ocean and beads represented fish. 30 of the beads were removed and replaced by different colored beads to show tagged fish in the ocean. 15 random catches of varying numbers of fish were taken and the number of tagged fish per catch was noted. This data was used to estimate the population. The percent error for the 30 tagged fish and 15 catch group was 70%. The data did not support the hypothesis which predicted that more tagged fish and more catches would yield more accurate results. The most successful combination was 10 tagged fish and 15 catch samples with a 1.5% error.
Problem-
What combination of sample fish and number of catches will yield the most accurate estimates of how many fish are in the oceans?
What combination of sample fish and number of catches will yield the most accurate estimates of how many fish are in the oceans?
Hypothesis-
If we have multiple groups performing experiments with any combination of 10, 20, or 30 sample fish and 10, 15, or 20 catches, then, the groups with 30 sample fish and 20 catches will have the most accurate results because they will have more trials which means more accurate results.
If we have multiple groups performing experiments with any combination of 10, 20, or 30 sample fish and 10, 15, or 20 catches, then, the groups with 30 sample fish and 20 catches will have the most accurate results because they will have more trials which means more accurate results.
Parts of the Experiment-
Control Group- Actual number of beads (representing fish) in the bag.
Experimental Group- Number of sample fish in each of the catches.
Independent Variable- The number of sample fish and the amount of catches.
Dependent Variable- Percent error of the estimated fish to the actual amount of fish.
Control Group- Actual number of beads (representing fish) in the bag.
Experimental Group- Number of sample fish in each of the catches.
Independent Variable- The number of sample fish and the amount of catches.
Dependent Variable- Percent error of the estimated fish to the actual amount of fish.
Materials-
Paper Bag
Beads
10, 20, 30 beads of a different color to represent tagged fish.
Paper Bag
Beads
10, 20, 30 beads of a different color to represent tagged fish.
Methods-
1. Remove either 10, 20, or 30 (depending on what your instructor told you, we used 30) beads from the bag and substitute them with beads of another color. These represent the tagged fish. Return the tagged fish to the bag.
2. Shake the bag.
3. Remove a small handful of beads from the bag and take note of the total amount of beads you pulled and then take note of the number of tagged fish in your sample.
4. Repeat step 3 either 9, 14, or 19 more times over (depending on what your instructor told you, we repeated step three 14 more times).
5. Find the average percent tagged from all 10, 15, or 20 of your samples.
6. Calculate your average population size.
Population size = number tagged/ mean of sample percentages
7. Count actual amount of beads in the bag and calculate percent error from the estimated and actual populations.
8. Compare to your classmates.
Data-
Data Analysis-
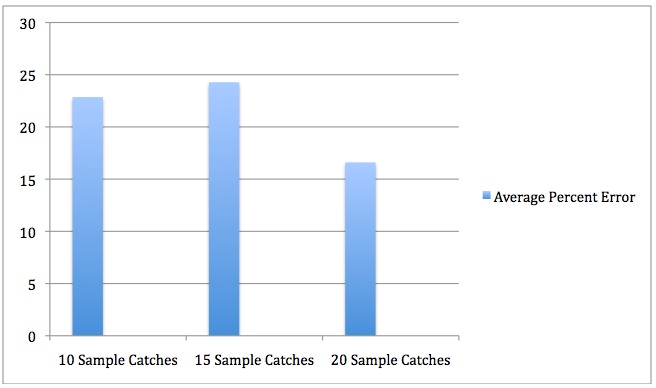
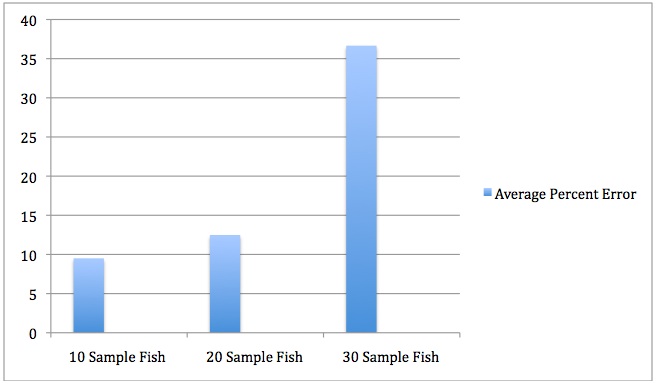
The data is surprising in the way that the smaller the tagged fish amount, the more accurate the estimate is, contradicting the hypothesis. The amount of catches seems not to matter much as there is really no apparent correlation to the amount of tests and the percent error. If one was to venture a guess, it would be that, according to the class statistics 10 tagged fish and 30 catches would be the most accurate. If less tagged fish really is the key, then, more catches would complete that equation. The biggest outliers are our group with a percent error of 70 and the 87.34 percent error group. Both had 30 fish tagged but the 87.34% group had 10 catches. I suppose this is evidence of the best combination being less tagged fish and more catches.
The data is surprising in the way that the smaller the tagged fish amount, the more accurate the estimate is, contradicting the hypothesis. The amount of catches seems not to matter much as there is really no apparent correlation to the amount of tests and the percent error. If one was to venture a guess, it would be that, according to the class statistics 10 tagged fish and 30 catches would be the most accurate. If less tagged fish really is the key, then, more catches would complete that equation. The biggest outliers are our group with a percent error of 70 and the 87.34 percent error group. Both had 30 fish tagged but the 87.34% group had 10 catches. I suppose this is evidence of the best combination being less tagged fish and more catches.
Conclusion-
The results were pretty much an exact opposite of the hypothesis. One would think that more tests and more fish sampled that the results could be pretty close to the exact number of fish. By this knowledge, less tests with less sample fish means more accurate estimates. The real indicator was in the sample fish with an over 36% average percent error when 30 fish were tagged compared to 9% when only 10 were tagged. It is really unknown as to why less tests can be more accurate, but in this case they were. 10 sample fish and 15 catches was statistically the most accurate combination of the 2, but, 10 sample fish and 10 catches also had a notably low percent error of 2.2%.
1. A cause that could increase the percent error would be catch size. If there are 300 fish in a bag and you sample 270 of them then your percent error will decrease drastically.
2. It makes sense that more tagged fish in an ocean would help you better estimate the population because there are more fish tagged and less untagged. In this experiment, the opposite occurred and less fish equaled better, more accurate results.
3. With the random # of fish in each sample catch, its difficult to have a solid number of tagged that should appear in each catch. Like stated earlier, if you draw 5 fish one catch and 240 the next, then, there would be inconsistencies.
4. This method does work as stated here by the NEAQ. This is the method scientists use and it is working quite impressively. This does work with the combination of 10 tagged fish and 15 sample catches which yielded a 1.5 percent error. So, it works, just not in the way that was expected.
5. Perhaps not. If you took the samples in a large ocean, the fish that you would tag would only be a fraction of a percent of the real population. In the experiment the best combination was the group that tagged the least fish.
6. A biologist should be aware of where the fish are concentrated so she doesn't take samples directly over a school of fish.
Citations-
"Counting the Fish in the Sea." Counting the Fish in the Sea. www.neaq.org, n.d. Web. 08 Nov. 2013.
"Counting the Fish in the Sea." Counting the Fish in the Sea. www.neaq.org, n.d. Web. 08 Nov. 2013.
